Introduction
Radar has become a ubiquitous technology, moving beyond aerospace and automotive applications into consumer electronics and IoT. With the advent of highly integrated mmWave sensors, it is now possible to bring sophisticated radar capabilities to compact, low-power platforms.
The dreamhat is a Raspberry Pi hat available from Pimoroni and uses a that an integrated 60 GHz radar sensor chip type BGT60TR13C from Infineon Datasheet.
Features
- 60 GHz radar sensor for FMCW operation
- 5.5 GHz bandwidth
- Antenna-in-package (6.5 x 5.0 x 0.9 mm³)
- Digital interface for chip configuration and radar data acquisition
- Optimized power modes for low-power operation
- Integrated state machine for independent operation
Rasperry Pi Hat
I have put my dreamhat on top of a Raspberry Pi 5 with a Waveshare PoE Hat:
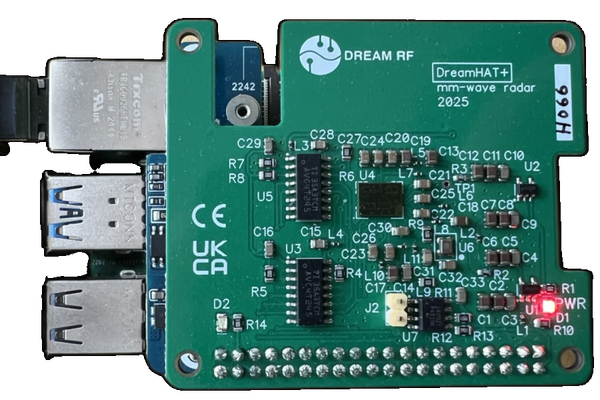
A closer view shows the 4 antenna elements realized as "Antenna in Package":

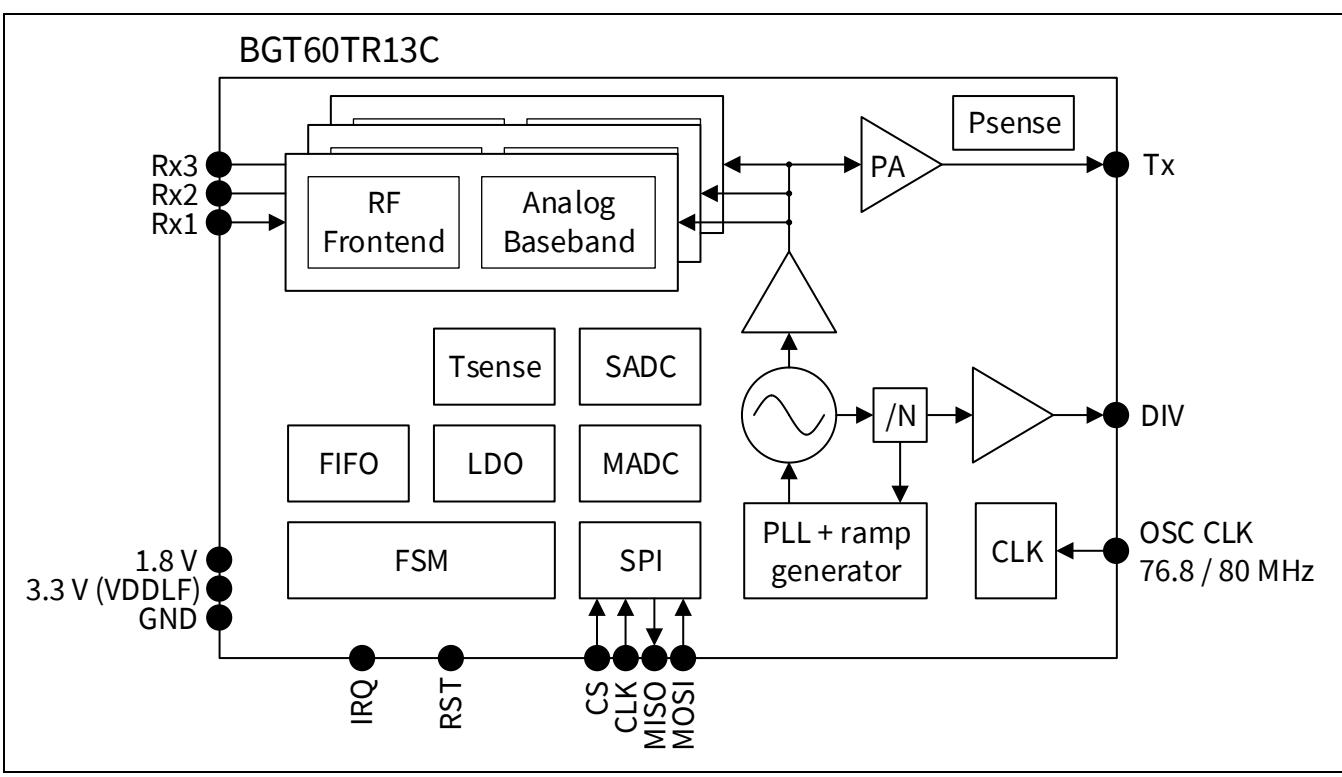
Block Diagram
The block diagram shows 1 transmit channel on the right side and 3 receive channels on the left side. Both receiver and transmitter are fed the millimeter-wave signal from the PLL-controlled oscillator, so it is a homodyne radar. The receive signals are sampled and can be streamed using the SPI bus with max. 50 MHz clock speed.
Setup
The Radar is designed to mount directly onto the Raspberry Pi's GPIO header. It utilizes the SPI interface for high-speed data transfer. For this project, I am using a Raspberry Pi 5, which provides sufficient computational power to process the radar data in real-time using Python and NumPy.
Software
I have created a Python package called piradar designed, to interface with the BGT60TR13C chip. It handles the SPI communication, chip configuration, and data acquisition, exposing the radar data streams via ZeroMQ for easy consumption by other applications.
All register access is abstracted through a YAML register description file, so no specialized tools beyond Python are required. The received data can be processed locally, or streamed over the network using PyZMQ.
First, to check the EEPROM in the hat:
$ piradar check-id
Checking chip ID...
2025-11-08 20:30:47 - piradar.hw.bgt60tr13c - INFO - Chip verified as BGT60TR13C
✓ Chip identified as BGT60TR13C
Then, let's run the streaming server for radar data:
piradar) juhasch@radarpi2:~/git/piradar $ piradar serve --config examples/radar_config.yaml
Press Ctrl+C to stop...
2025-11-08 20:51:16 - piradar.hw.radar_controller - INFO - Created 31 radar parameters from register map
2025-11-08 20:51:16 - piradar.hw.zmq_handler - INFO - Data publisher bound to tcp://0.0.0.0:5555
2025-11-08 20:51:16 - piradar.hw.zmq_handler - INFO - Command socket bound to tcp://0.0.0.0:5556
2025-11-08 20:51:16 - piradar.hw.zmq_handler - INFO - Status publisher bound to tcp://0.0.0.0:5557
2025-11-08 20:51:16 - piradar.hw.zmq_handler - INFO - Registered handler for command: start
2025-11-08 20:51:16 - piradar.hw.zmq_handler - INFO - Registered handler for command: stop
2025-11-08 20:51:16 - piradar.hw.zmq_handler - INFO - Registered handler for command: configure
2025-11-08 20:51:16 - piradar.hw.zmq_handler - INFO - Registered handler for command: get_status
2025-11-08 20:51:16 - piradar.hw.zmq_handler - INFO - Registered handler for command: read_parameter
2025-11-08 20:51:16 - piradar.hw.zmq_handler - INFO - Registered handler for command: write_parameter
2025-11-08 20:51:16 - piradar.hw.zmq_handler - INFO - Registered handler for command: batch_write
2025-11-08 20:51:16 - piradar.hw.zmq_handler - INFO - Registered handler for command: get_parameter_info
2025-11-08 20:51:16 - piradar.hw.zmq_handler - INFO - Registered handler for command: list_parameters
2025-11-08 20:51:16 - piradar.hw.zmq_handler - INFO - Registered handler for command: get_parameter_state
2025-11-08 20:51:16 - piradar.hw.zmq_handler - INFO - Registered handler for command: import_parameter_state
2025-11-08 20:51:16 - piradar.hw.zmq_handler - INFO - Registered handler for command: reset_parameters
2025-11-08 20:51:16 - piradar.hw.zmq_handler - INFO - Registered handler for command: get_performance
2025-11-08 20:51:16 - piradar.hw.zmq_handler - INFO - Registered handler for command: read_register_field
2025-11-08 20:51:16 - piradar.hw.zmq_handler - INFO - Registered handler for command: write_register_field
2025-11-08 20:51:16 - piradar.hw.zmq_handler - INFO - Registered handler for command: list_all_registers
2025-11-08 20:51:16 - piradar.hw.zmq_handler - INFO - Adaptive radar control handlers registered
2025-11-08 20:51:16 - piradar.hw.zmq_handler - INFO - Async command listener started
radar_config: start_frequency_Hz=58500000000 stop_frequency_Hz=62500000000 chirp_duration_s=0.0001 frame_length=32 frame_duration_s=0.04 output_power=15 adc_sample_rate_Hz=2000000
2025-11-08 20:51:16 - piradar.hw.bgt60tr13c - INFO - Start frequency for sequence 0 set to 58.500 GHz (FSU1: 11960320, DIVSET: 20)
2025-11-08 20:51:16 - piradar.hw.bgt60tr13c - INFO - Stop frequency for sequence 0 set to 62.500 GHz
2025-11-08 20:51:16 - piradar.hw.bgt60tr13c - INFO - Frame repetition period set to 40.000000 ms (inter_frame_delay=8.738000 ms)
2025-11-08 20:51:16 - piradar.hw.bgt60tr13c - INFO - Output power set to 15
2025-11-08 20:51:16 - piradar.hw.bgt60tr13c - INFO - ADC sample rate set to 2.00 MHz
2025-11-08 20:51:16 - piradar.hw.bgt60tr13c - INFO - ADC_DIV register value: 40
2025-11-08 20:51:16 - piradar.hw.bgt60tr13c - INFO - ADC sampling frequency: 2.00 MHz
2025-11-08 20:51:16 - piradar.hw.bgt60tr13c - INFO - RTU1 register value: 1000
2025-11-08 20:51:16 - piradar.hw.bgt60tr13c - INFO - Calculated chirp duration: 100.00 µs
2025-11-08 20:51:16 - piradar.hw.bgt60tr13c - INFO - Expected samples for chirp duration: 200
2025-11-08 20:51:16 - piradar.hw.bgt60tr13c - INFO - num_rx_channels: 3
2025-11-08 20:51:16 - piradar.hw.bgt60tr13c - INFO - num_tx_channels: 1
2025-11-08 20:51:16 - piradar.hw.bgt60tr13c - INFO - frame_duration: 39.97 ms
2025-11-08 20:51:16 - piradar.hw.bgt60tr13c - INFO - k_chirp: 57958984375000.00 Hz/s
Now I can run my processing and visulaization on a PC by connecting to the radar over the network.
Examples
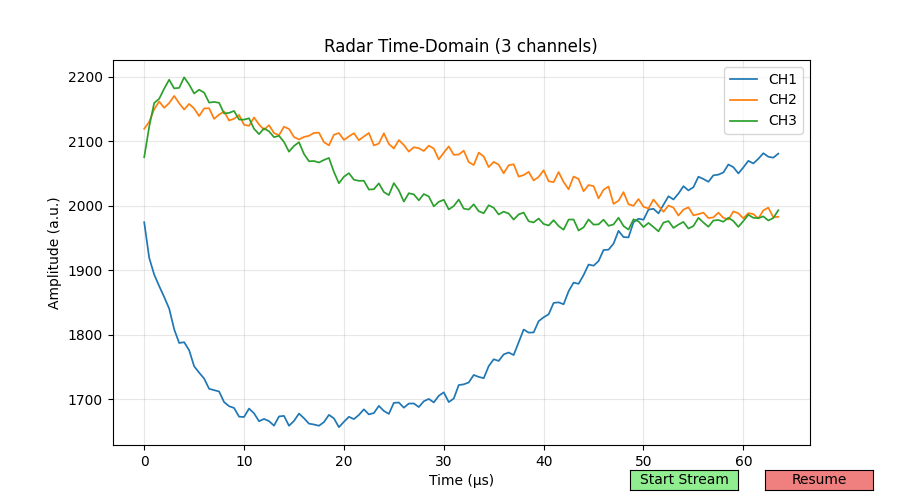
Time Domain Signals
A typical time domain receive signal is shown here:
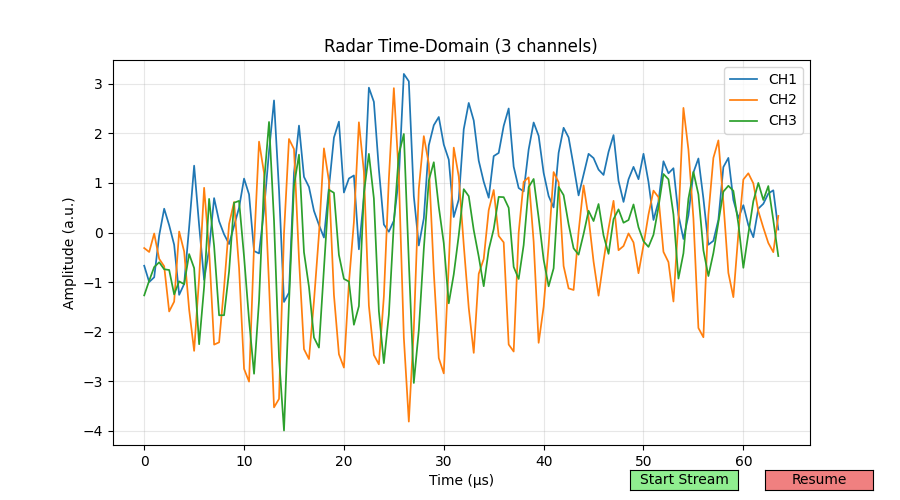
If you subtract the static signals you get:
Range Amplitude
The first thing to analyze is the Range Profile (or Range-Amplitude plot). Here, I am using an improvised small corner reflector (trihedral) as a target. This visualization shows the strength of the reflected signal versus distance. Peaks in this plot correspond to targets located at specific distances from the radar.
Range Profile
Range Phase
You can also look at the phase of the target peak signal, to get a much more sensitive display of distance changes:
Range Phase Profile
Range Doppler
A typical radar visualization is the Range-Doppler plot, showing the range in one direction, radial velocity (Doppler) in another direction and the aplitude as color code.
In this example I used a small steel sphere, hanging on a wire from the ceiling, as target.
Range-Doppler Map
Waterfall
To visualize movement patterns, the waterfall display is helpful. It shows the amplitude of the highest peak for each velocity in the x direction and scrolls progressively over time in the y direction:
Range-Time (Waterfall) Plot
Antenna
The antennas are placeed on the package as show below:
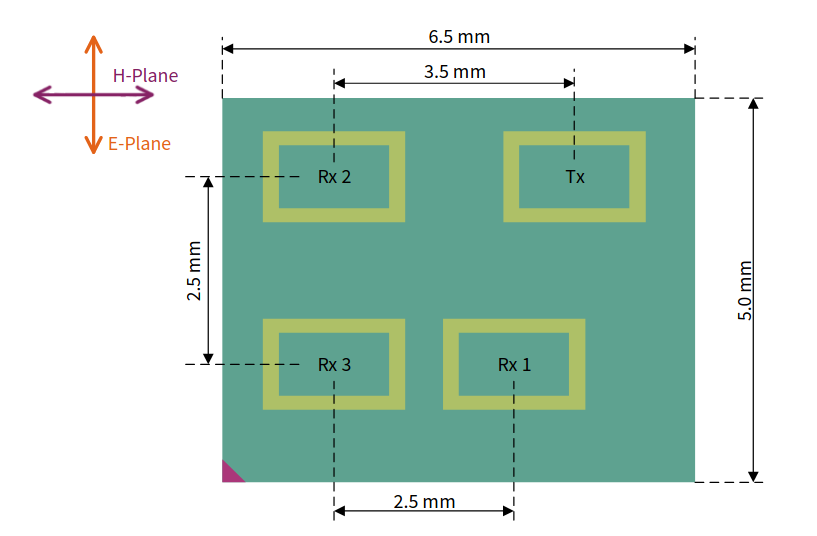
This allows the angle-of-arrival estimation of remote targets in azimuth and elevation. As there is only a single phase-difference information from either RX1-RX3 or RX2-RX3, the angle estimation is restricted to single targets for a given range-velocity.
I did a first antenna pattern measurement on an improvised rotating table. However, the boresight is a little off. I will repat it to get a better characterization.

Here is a plot of the phase:
